 |
This is not a comprehensive bioinformatics web. It is just a introduction of my experience in the field of bioinformatics.
As a major competitor of Perl, "we know of no Perl feature that cannot be emulated easily in Python" (- Aaron Watters, et al.). While more and more programmers are turning to Python, Lars Marius Garshol explained his journey from Perl to Python in the page What's wrong with Perl. Unlike Perl, Python is also good for big projects development beside small programs, this makes it a ideal tools for bioinformatics. The Open Bioinformatics Foundation supports the BioPython project, an international association of developers of freely available Python tools for computational molecular biology.
The database of Monogenea in China was built when I was a PhD candicate (1995-1997). This is a relationship database implemented with Microsoft Visual Foxpro. Both biological data and ecological data of all monogenean species in China were input into the database. User inferface for inquiring and updating were offered by a series of programs writted in Foxpro.
The following is part of my works during the period from 1997 to 2000.
A new method for classifying was brought out and achieved by programming to cluster given operational taxonomic units (OTUs). This method strictly requires more similarities or less difference among OTUs which are placed in a group than between any of them and any OTU in other groups, so it is called compact group method (CGM). During the clustering course of CGM, similarities between OTUs are weighted by relationship coefficient, and the throughout process of clustering depends on the original relationship coefficient matrix, with no new relationship coefficient needing to calculate. This significant character difference to other clustering methods helps CGM to avoid a source which usually causes somewhat subject and even obvious mistake results. Since CGM allows more than one new group generated in a clustering cycle, and will not limit the number of OTUs or groups which are used to form a new group, either, it naturally belongs to multigroup variable group method. Some sufficiency index were coined to evaluate the clustering result by CGM. The algorithm is implemented in the programs Taxonomy
The monogenean genus Gyrodactylus was split into subgroups and species groups by Malmberg (1970), based on the characteristics excretory systems and the marginal hooks. A try for the same object based on 5S rDNA was presented in this paper. Using compact group method to cluster molecular data led to a similar result to Malmberg's. But it seemed suitable to move Gyrodactylus turnbulli from the G. eucaliae group into the G. arcuatus group. The G. salaris group may be redundant since G. salaris has a relative close similarity with species of the G. wageneri group. The result also showed in the rough more similarities among Gyrodactylus spp. whose hosts were close in phylogenesis, suggesting 5S rDNA be of importance significance not only on classification of the Gyrodactylus genus but also the host-parasite relationship.
Based on analysis of base sequences of 18S rDNA and 28S rDNA, some problems on high hierarchy classification of monogenean were discussed. Polystomatides showed a close relationship with species of Oligonchoinea, instead of Polyonchoinea. Since their opisthohaptor are similar to Oligonchoinea species, too, it is considered suitable to place Polystomatidae in an independent superorder under Oligonchoinea. Testimonies from rDNA also suggest place the genus Diclidophora in the suborder Discocotylinea Bychowsky, 1957 of the Mazocraeidea order, raise the Diplectanidae Monticelli, 1903. under the Dactylogyridea order to a single order, and support the existence of the family Ancyrocephalidae as well. Anoplodiscidae Tagliani, 1912 can be raised to form a order, rather than a family under the order Gyrodactylidea Bychowsky, 1937. Gyrodactylus spp. showed an enormous difference to other monogenean species, which is attributed to its unique viviparous production manner and unusual rapid differentiation and evolution rate.
This is the job I did at the Department of Genetics, University of Cambridge. The first version of DiMSim has been worked out. At present I am use DiMSim to do some metabolic pathway simulations. The procedure is simple. The first step is just using tools (buttons) offered in the tool bar to draw a network to be modelled; after filled in necessary parameters, trigger the system, then monitor the dynamcs of concerned variables and wait results.
DiMSim can deal with modification (activation/inhibition), allosteric and cooperative behaviors of enzymes, can model channeling, signal cascades, transcription/translation, too. It is a excellent tool for metabolic simulation. A brief introduction was given in some slides as well.
DiMSim is available under license free-of-charge to non-commecial/academic users. The license agreement may be found here. Researchers from the commercial domain wishing to obtain the suite should use this
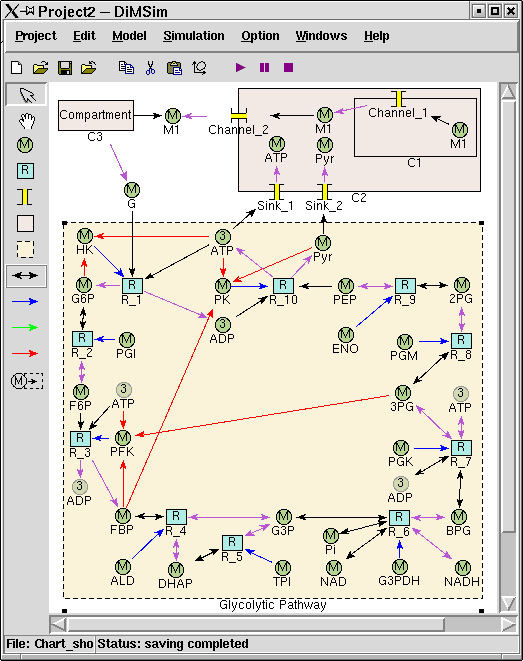
The graphical user interface (GUI) of DiMSiM is based on Tkinter/Tk. The GUI offers a main menu, and two tool-bars. The buttons in the horizon tool- bars below the menu are designed to deal with file operations, metabolic pathway edition and simulation controlling. The vertical tool-bar contains tools to build a graph of metabolic pathway. On screen a pathway is represented by a compartment, in which the metabolite icons and reaction icons are connected by arrows. Arrows express different relationships among icons by using different colors. The following figure is a screen capture of the graphical user interface.
The above figure depicts a number of interconnected pathways including the Glycolytic Pathway subsystem and four compartments, i.e. Compartment_1(C1), Compartment_2(C2), Compartment_3(C3) and the outermost compartment(OC) that contains all other objects. Metabolite_1 is transferred from C1, to C2 by Channel_1, and to OC by Channel_2, then to C3. G (Glucose) is the transferred from C3 to OC, and then used by glycolytic pathway which is enclosed as a subsystem. The two products of glycolytic pathway, ATP and Pyr, are eventually moved into C2 by two sinks (Sink_1 and Sink_2).
Waiting for updating ...
Waiting for updating ...
These are my works at Sidney Kimmel Cancer Center.
WebArray is a web site for microarray data analysis. It run on a LAMP system (Linux + Apache + MySQL + Python). Data analysis is powered by R/bioconductor/LIMMA. The R code for data analysis was offered by Yipeng Wang. A brief introduction was given in some slides.
While cross-platform microarray analysis is becoming more popular, researchers still lack open source tools for storing, integrating, and analyzing large amounts of microarray data obtained from different microarray platforms and various sources. An open source integrated microarray database and analysis suite - WebArrayDB, has been developed. WebArrayDB features convenient uploading of data for storage in a MIAME (Minimal Information about a Microarray Experiment) compliant fashion, and allows data to be mined with a large variety of R-based tools, including data analysis across multiple platforms. Different methods for probe alignment, normalization and statistical analysis are included to account for systematic bias. Student’s t-test, moderated t-tests, non-parametric tests, and ANOVA/ANCOVA are among the choices of algorithms for differential analysis of data. Users also have the flexibility to define new factors and even make new analysis models to fit complex experimental design. All data can be queried or browsed through a web browser. The computations can be performed using multiple CPU cores on SMP systems or a Linux cluster.
Being powerful for cross-platform data alignment and analysis, WebArrayDB can be used as a pure cross-platform microarray database as well. A brief introduction was given in some slides. Tutorial movies in variety of languages can be found at .